|
formatter 提示框浮层内容格式器,支持字符串模板和回调函数两种形式。
可以通过formatter 函数 可以动态的修改 我们想要展示的数据
第一种: 字符串模板 – 官网
字符串模板
模板变量有 {a}, {b},{c},{d},{e},分别表示系列名,数据名,数据值等。
示例:
formatter: '{b0}: {c0}{b1}: {c1}'
第二种: 回调函数 – 官网
回调函数
回调函数格式:
(params: Object|Array, ticket: string, callback: (ticket: string, html: string)) => string 第一个参数 params 是 formatter 需要的数据集。格式如下: 
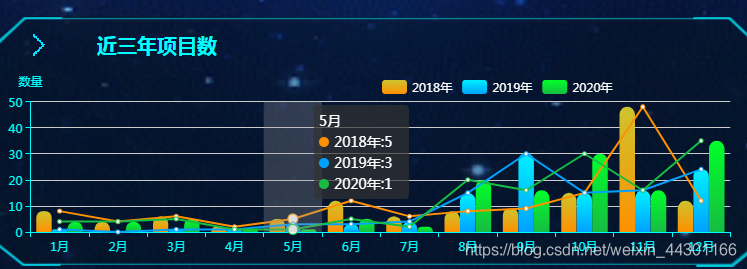
项目需求–如图 formatter函数 显示的效果
实际开发显示的效果图
显示的数据重复 ---- 可以通过 formatter 函数来去除数据重复的效果
 代码如下: 代码如下:
tooltip: {
trigger: 'axis',
axisPointer: {
type: 'shadow'
},
formatter: (params) => { //格式化数据的函数
console.log('我的参数', params.slice(-3))
var listData = params.slice(-3) // 获取对应的数据
var list = []
var listItem = ''
var html = ''
html += ''+listData[0].name+''
for (var i = 0; i
tooltip: {
trigger: 'axis',
axisPointer: {
type: 'shadow'
},
formatter: (params) => { //格式化数据的函数
var listData = params.slice(-3)
var list = []
var listItem = ''
var html = ''
html += ''+listData[0].name+''
for (var i = 0; i
textStyle: {
color: '#fff',
},
x: '50%',
data: ['2018年', '2019年', '2020年'],
},
grid: {
left: '2%',
right: '4%',
bottom: '0%',
top: '15%',
containLabel: true
},
xAxis: [{
type: 'category',
axisLine: { //---坐标轴 轴线
show: true, //---是否显示
lineStyle: {
color: '#00FFFF',
width: 1,
type: 'solid',
},
},
data: ['1月', '2月', '3月', '4月', '5月', '6月', '7月', '8月', '9月', '10月', '11月', '12月']
}],
yAxis: [{
type: 'value',
name: '数量',
axisLine: { //---坐标轴 轴线
show: true, //---是否显示
lineStyle: {
color: '#00FFFF',
width: 1,
type: 'solid',
},
},
axisLabel: {
formatter: '{value}'
},
splitArea: { //--网格区域
show: false, //---是否显示,默认false
}
}],
series: [{
name: '',
type: 'line',
color: '#ff9000',
data: [8,4,6,2,5,12,6,8,9,15,48,12],
}, {
name: '',
type: 'line',
color: '#00a2ff',
data: [1,0,1,1,3,3,4,15,30,15,16,24],
}, {
name: '',
type: 'line',
color: '#17bc42',
data: [4,4,5,1,1,5,2,20,16,30,16,35],
},
{
name: '2018年',
type: 'bar',
data: [8,4,6,2,5,12,6,8,9,15,48,12],
barGap: '1%', // 柱图间距
itemStyle: {
normal: {
color: new echarts.graphic.LinearGradient(0, 0, 0, 1, [{
offset: 0,
color: '#cdc42e'
}, {
offset: 1,
color: '#ff9000'
}]),
barBorderRadius: [15, 15, 0, 0]
}
},
}, {
name: '2019年',
type: 'bar',
data: [1,0,1,1,3,3,4,15,30,15,16,24],
barGap: '1%', // 柱图间距
itemStyle: {
normal: {
color: new echarts.graphic.LinearGradient(0, 0, 0, 1, [{
offset: 0,
color: '#00f0ff'
}, {
offset: 1,
color: '#00a2ff'
}]),
barBorderRadius: [15, 15, 0, 0]
// color: '#000'
}
},
}, {
name: '2020年',
type: 'bar',
data: [4,4,5,1,1,5,2,20,16,30,16,35],
barGap: '1%', // 柱图间距
itemStyle: {
normal: {
color: new echarts.graphic.LinearGradient(0, 0, 0, 1, [{
offset: 0,
color: '#00ff2a'
}, {
offset: 1,
color: '#17bc42'
}]),
barBorderRadius: [15, 15, 0, 0]
}
},
},
]
};
|